
March 1958 (Mauna Loa measurements begin) / Oceania
Long-term carbon dioxide measurements reveal the Keeling Curve
Precise atmospheric carbon dioxide measurements at Mauna Loa gradually distinguish seasonal variation from a sustained long-term increase.
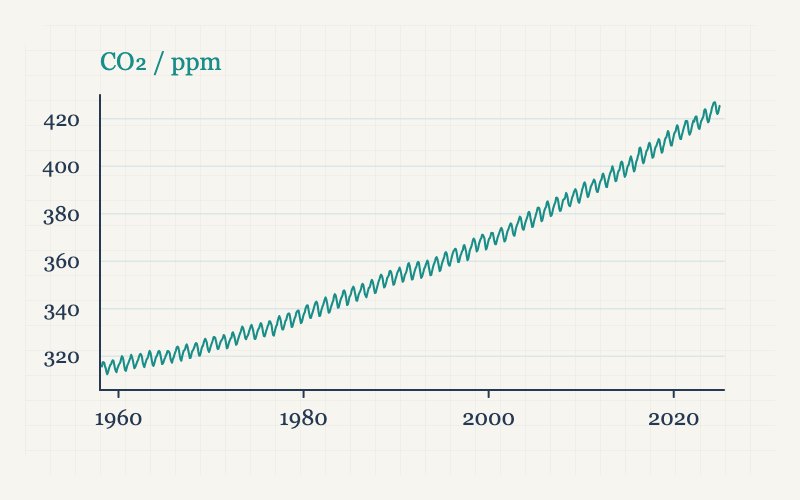
Image unavailable. The caption and source are still available.
The story
The Mauna Loa series began in March 1958 and depended on calibration, station maintenance and comparable measurements over time. Keeling and colleagues also worked within a program that included Antarctic sites; this was not humanity’s first measurement of atmospheric carbon dioxide. Successive years revealed seasonal variation and an accumulating increase. The concentration record became important evidence for carbon-cycle and climate research. Explanations of causes and climate effects also draw on other observations and physical theory.
Connections and context
A continuing record can reveal gradual changes that a single measurement misses. The work connects Earth science, analytical chemistry and global observation.
Dates and precision
March 1958 (Mauna Loa measurements begin) Documented date
Positioned by the documented year, month or day. Missing precision is not inferred.
Representative map location
Mauna Loa
The marker represents the Mauna Loa station in Hawaii, not every participating station. Hawaii is grouped here within the Pacific geographical region of Oceania.
Representative coordinates · 19.5362°, -155.5763°
A marker identifies one representative place, such as a manuscript collection, laboratory or observing site. It does not mean the work happened only there, or assign a shared discovery to one country.
Bibliography
- Scripps Institution of Oceanography: The history of the Keeling Curve
- American Chemical Society: The Keeling Curve — carbon dioxide measurements at Mauna Loa
References are listed as plain bibliography titles. They support particular facts or context; a reference does not certify every interpretation in a story.